Metrics in Prometheus
Metrics in Prometheus

Metrics are data collected from the target and stored in a time-series database. These Metrics are collected or scrapped at a fixed interval of time. As the Prometheus scrapes metrics it also stores the timestamp of it.
How Prometheus collects Metrics from Target??
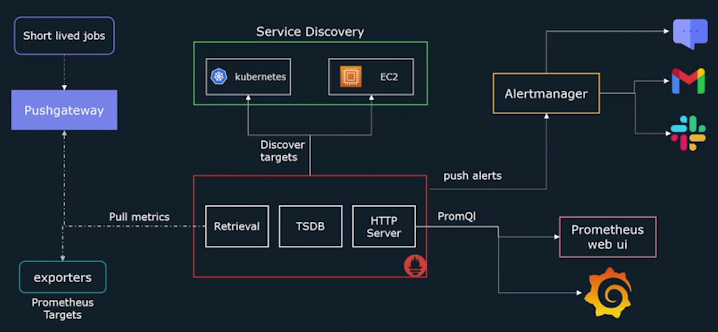
It fundamentally relies on scrapping or pulling, metrics from defined endpoints or targets. And on these targets or endpoints, some kind of agents are running that expose metrics in the format that Prometheus can understand. And these agents can be exporters or instrumentation or pushgateway. To scrap metrics or pull metrics from targets or endpoints, Prometheus sends HTTP requests to the “/metrics” endpoint of that target.
For example:
Scraped metrics are then stored in a time series database which can be queried using Prometheus built-in query language “PromQL”
Any metric has 3 components:
- Metric Name
- Labels in form key/value pairs
- Value
Every Metric has 2 Attributes:
- TYPE
- Represents the type of metrics.
- HELP
- description of what metrics are all about.
Types of Metrics Prometheus supports:
- Counter
- Gauge
- Histogram
- Summary
What are Counter Metrics ??
It represents how many times something happens. It is numerical in value. It only increases and also can be reset to 0 but never decreases.
For Example:
- The total number of requests served.
- To number of exceptions.
- Total number of Job Executions
NOTE: Use it for straightforward time-series data.
What is Gauge Metrics ??
It represents the current value of something. The values can increase or decrease. Typically used for measuring values like CPU, Memory, Disk usage, etc.
Examples:
- Current CPU Utilization
- Available System Memory
- Number of concurrent Requests.
What is Histogram Metrics ??
It represents "how long something happens". It helps to calculate the average of observed values.
Examples:
- Response time
- < 1s - how many responses in less than 1s
- <0.2s - how many responses in less than 0.2s.
- Request Size
- <1500 Mb - how many requests under 1500 Mb Size.
- >500 Mb - how many requests greater than 1500 Mb Size.
What is Summary Metrics ??
Similar to the histogram metric. It also tracks how long something happens and how much something happens.
Metric Naming Rule ??
- Metric Name specifies a general feature of a system to be measured.
- The name may contain ASCII letters, numbers, underscores, and colons.
- Must match the regex- [a-zA-Z_:][a-zA-Z0-9_:]*
- Colons are reserved only for recording rules.
Label naming Convention Rule ??
- Labels are key/value pairs associated with a metric. These labels are used to filter or match specific metrics.
- Metric can have more than 1 label.
- The name may contain ASCII letters, numbers, and underscores.
- Must match regex- [a-zA-Z0-9_]*
NOTE: Every metric has be default 2 labels: Instance and Job.


Comments
Post a Comment