Prometheus Architecture...
Prometheus Architecture
Look at the below figure, and we can see that Prometheus has major 3 things:
- to pull Metrics,
- store it in the Time-Series database, and
- allow third parties to retrieve metrics using PromQL
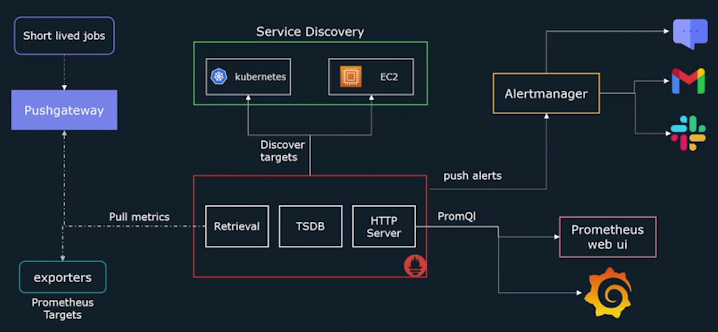
Components of Prometheus:
There are 3 main components of Prometheus:
- Retrieval/Pull Metrics
- This component of Prometheus is mainly responsible for pulling metrics from targets.
- Targets can be exporters, instrumentation, and pushgateway.
- Time Series Database
- Once the retrieval collects data from the target, then it transfers to a time-series database.
- The data are stored in the form of a metric. Each metric is identified by its name and labels.
- HTTP Server
- It allows collected time-series data from the time-series database to be available for querying by third-party tools such as Prometheus web UI, Alertmanager, etc.
- These tools use a Query language known as PromQL to query metrics.
We get to know that Prometheus scrapes metrics from target endpoints. But the question arises, who collects metrics from target nodes(or machines) and exposes them to the target endpoint? The simple answer is agents. From use case to use case, there can be different agents such as:
- Exporters
- Instrumentation
- Pushgateway
Exporters ??
Your servers or system or node don't automatically expose the internal data of the system in the consumable format of Prometheus. So, we need some kind of tools that can take internal data, convert it into the format that Prometheus understands, and finally expose it to the "/metrics" endpoint. And that tool is none other than exporters. As the name itself signifies exporting something.
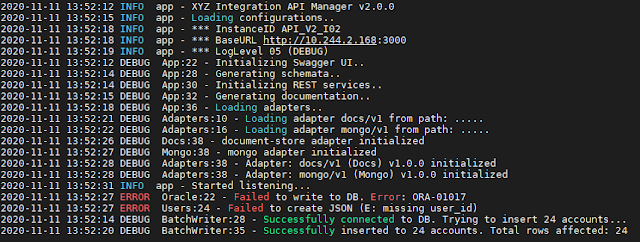
By definition, an exporter is a piece of program or software that runs in the target machine(or node) and collects data of a service or internal process running in that machine and exposes it. The exposed data looks as shown in the below figure.

The popular exporter is "node_exporter". It retrieves data such as I/O, RAM, CPU, Disk, filesystem usage, Network stats, etc, and exposes them. The exposed data contains 2 fields: HELP(description of what metrics is) and TYPE(type of metric) only. They are plain text and highly readable, which is one of Prometheus's strengths. And these exposed data or metrics are being pulled by Prometheus.
But the problem with the pull-based model is that there are some short-lived jobs that exist for a short period of time, as a result, Prometheus will miss out on pulling the data from it. Therefore, that’s why we have a component called Pushgateway.
Pushgateway ??
In our system, there are short-lived jobs or processes running in the system, as these jobs or process doesn't last long enough time for Prometheus to be able to scrape metrics from them. To avoid losing metrics from these short-lived jobs or processes, the Prometheus team reversed the design from pull-based to push-based. Therefore, short-lived jobs or process will push their metrics to the pushgateway and the pushgateway exposes it to the "/metrics" endpoint. And later on, Prometheus will pull the metric from the "/metrics" endpoint like any other target.
So, till now Prometheus is able to pull metrics from the system, and short-lived process. But what if we want to send metrics from our custom application or custom program written in some programming languages such as golang, python, etc. For that, we require application instrumentation.
Application Instrumentation??
To send metrics from our custom program we need to use Prometheus client libraries to do so. These client libraries allow you to expose any application metrics you need Prometheus to track. Additionally, it also supports exposing metrics and converting in the format that Prometheus understands.
Prometheus has client libraries for various different languages:
- Golang
- Java
- Python
- Ruby
- Rust
- And many more
So, after scrapping metrics from different sources, the retrieval component passes the metric to the database.
Time-series database ??
Data are collected from the target endpoint at a fixed interval of time. The time interval provides the timestamp after every scrapping. When the data and timestamp combine together, they are called metrics.
NOTE:
- What is meant by time-series data?
- Every combination of metrics and unique labels (and their value) is going to be one time series.
To store these time-series data or metrics it requires a special type of database known as time-series database. The time-series database has the following things:
- timestamp
- Value
- metric name
We get to know about the time-series database. But where do these are stored and how?? So, these metrics are stored on a local disk or storage. It requires 3 steps to store data locally:
Memory:
- Firstly, the fresh batch of data is stored in Memory for 2 hours.
- This reduces disk I/O.
Write Ahead Log(WAL)
- As we know memory is non-persistent in nature and could lead to loss of the data if the process terminates. To prevent this scenario, a WAL in disk keeps the state of in-memory data so that it can be replayed if Prometheus, for any reason crashes or restarts.
Disk
- Lastly, after a 2-hour time window, the chunks get written to disk.
HTTP Server
To retrieve these metrics from the time-series database any request has to go through the HTTP server. The HTTP server is responsible for querying the metrics. In order to query, it requires a query language known as PromQL. In short and simple, it accepts PromQL queries from different tools such as Prometheus UI, Alertmanager, Grafana, etc.
Next, we will learn about PromQL language but before jumping into next let's get familiar now with one more component of Prometheus i.e. Service Discovery.
Service Discovery ??
In addition to that, Prometheus expects you to hard code all of the targets that it needs to scrape matrices. To do so, we have to configure a list of targets in the configuration file. However, in environments where target machines are very dynamic in nature. Things like Kubernetes where pods keep spinning up and down, or EC2 instances spinning up and down in case of auto-scaling, in such cases require dynamically updating the list of targets in the configuration file. And that’s where the use of Service discovery comes into play.
Service discovery is all about providing a list of targets for Prometheus to scrap so that you don’t have to hard code the targets every time as the targets dynamically change.
After receiving the metrics from the list of all targets. It is stored in a time series database because these metrics are collected at a fixed time. So, they are classified with time intervals. To store these time-series data, it requires a special kind of time-series database instead of a normal database such as NoSQL, etc. Later on, these metrics will be queried for different purposes such as:
- Alerting for Alertmanager
- Prometheus Web UI
- Visualization tools such as Grafana.
To query these metrics data from the Prometheus HTTP server requires a query language known as PromQL. Everyone whether Prometheus Expression browser, Grafana, or Alertmanager behind the scene uses PromQL to query metrics.
Prometheus Expression Browser ??

And obviously, once Prometheus collects the data, we want to see those data. To do so, we need an interface from which we can query metrics, and that interface is the Prometheus Expression browser.
Alertmanager ??
The primary purpose of alertmanager is to alert before something happens. For say, Disk is filling up and only a few GiBs are left. The primary purpose of the alert is to awaken the developer to take a look into it. Let's see how it is used with Prometheus.
As we have discussed, Prometheus is used to generate alerts. Prometheus is simply responsible for triggering an alert, but not responsible for sending emails, or SMS. However, we need a separate entity called Alertmanager, which handles all of the SMS, the emails, and the SMTP integration. So that it can send the notification to the end user. When an alert is triggered or a defined condition or rule is met, Prometheus is going to push an alert to a process called Alertmanager. Then Alertmanager will be responsible for routing an alert notification to email or Slack or whatever integration you choose.
At a very high level, Alertmanager is a service that receives HTTP POST requests from the Prometheus server via its API.
Alertmanager also has a web interface to allow:
- The visualization of alerts
- Silencing of firing alerts
- Applying inhibition rules.
Next, we will learn about the query language called PromQL, which is used by many third-party tools to query metrics.


Comments
Post a Comment