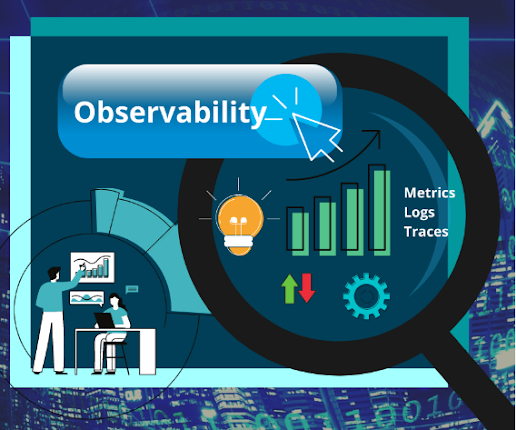
Observability 101
Hey Everyone !! Good to see you all here to learn Prometheus. This blog is the prerequisite to learning Prometheus. Prometheus is a part of Observability. Before wasting our time, let's jump into the topic called Observability.
Observability Fundamentals
What is Observability ??
Observability == Observe + Ability.
Observability is made up of 2 words: Observe and Ability.
Observe means to observe the data generated from the system, and the ability means to measure and understand the system's state based on the generated data.
In the broader sense, Observability gives you the insight of the system's internal working of each component. And that helps while troubleshooting an issue.
From where does the concept of Observability come in??
In the early days when applications were deployed in Monolithic structures, humans were able to monitor each component present in the system/server due to the limited number of components.
As the microservice application started to boom, the complexity of infrastructure grew more and more. Due to its complex architecture, it became impossible for a human to monitor/check each and every component of an infrastructure. It is impossible or unthinkable to manually validate the health of each instance/node/machine, caching, service, database, or load balancer. Without keeping an eye on each component of infrastructure, it becomes hard for humans to track down the internal issue. Due to this, we needed some tools to monitor or keep an eye on each component on behalf of human beings. That’s why Observability tools were created. And among them one is Prometheus.
How does Observability help in Troubleshooting system ??
To troubleshoot an issue inside the system, we need more information about the component than just what is wrong. Instead of "what happens", we need to know "why it happens". So, to know "why", we need proper information about that particular component.
For example:
- Why are error rates rising?
- Why is there high Latency?
- Why are services timed out?
- Why Memory OOM killer?
How to accomplish Observability ??
There are 3 main pillars by which Observability can be accomplished:
- Logging
- Tracing
- Metrics
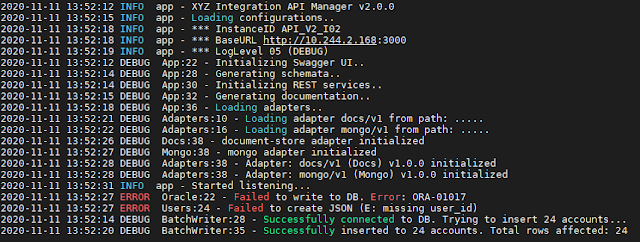
What is Logging?
Logging means recording events that have occurred in the system along with the Timestamp. Basically, it gives the details of occurred events.
Logging has 2 components:
- Message: Information about a particular event.
- Timestamp: time at which event occurred.
Logs are one of the common forms of Observation produced by the system itself without adding any external tool.
One of the popular tool for logging is Fluentd.
What is Tracing??
From the name itself, it highlights tracing something. It means traversing through the components of the system and service. It follows an individual request hop by hop and helps in connecting the dots on how processes and services work together.
It works in a way that each trace has a trace-id that can be used to identify a request as it traverses the system.
Popular tools for tracing are OpenTelemetry and Jaeger.
What is Metrics??
It provides information about the state of the system through numerical values or stats:
- CPU Load
- Number of Open Files
- HTTP response time
- Number of errors.
These data are aggregated over time and graphed using visualization tools to identify trends over time.
Popular tools are Prometheus, Cortex, OPEN METRICS, Thanos, and other tools are Headlamp, Inspektor Gadget, Kepler, Kuberhealthy, Pixie, Skooner, and Trickster.
A metric contains 4 pieces of information:
- Metric Name
- Value
- Timestamp
- Dimensions
In conclusion, we can say that Logs, Metrics, and Tracing are the 3 main pillars of Observability. Prometheus is a monitoring tool that is responsible for collecting and aggregating metrics. Therefore Prometheus is a Metric tool. Prometheus has nothing to do with the other 2 pillars i.e. Logs and Tracing.


Comments
Post a Comment