Monitoring 101
What is Monitoring ??
Monitoring refers to a tool that collects metrics data, provides a dashboard to visualize the collected data, and generates alerts based on alerting rules.
Monitoring tool =~ Metrics + Visualization + Alerting
Monitoring can be done in 2 ways:
- Blackbox Monitoring
- Whitebox Monitoring
BlackBox Monitoring
In this type of monitoring, Applications or Systems are monitored/observed from outside via APIs.
Whitebox Monitoring
In this type of monitoring, Applications or Systems are monitored or observed from inside. Here, the system itself is under observation which exposes its internal state data and performance data of the system.
This type of internal introspection is very powerful because it exposes the operating system telemetry and the health of each different internal component.
So after collecting internal state data, now we need to know, what are different ways to expose or send these data?
There are 3 different ways to expose the data:
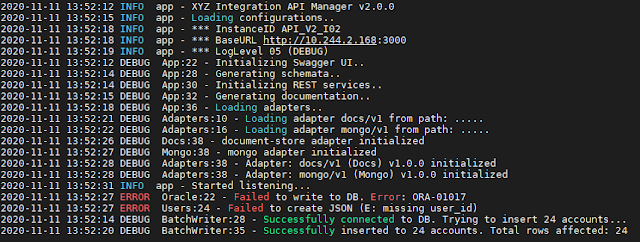
- Exported through logging
- Emitted as structured events
- Maintained in Memory as aggregates
- Hers, the collected data is exposed via an endpoint, i.e. "/metrics".
- The default way of exposing metrics for Prometheus.
Till now we learned that we follow whitebox monitoring to monitor the system from inside. After monitoring the internal state of the system, data is collected which is exposed to an endpoint i.e. "/metrics". But how these metrics will be sent to a Centralized server. There can be any centralized server, but in our case, we are considering it a Prometheus Server.
The generated metrics can be collected in 2 ways:
- Push based model
- Pull based model
Push Based Model
In this model, the target machine is responsible for sending metrics to the centralized server. Here, centralized servers don't have to know about their target machine. Therefore, the quantity of target machines is unknown. So, at a time there can be hundreds, thousands, or even many more servers pushing metrics to the centralized server at the same time, due to which it becomes hard for a Centralized server to handle a large amount of incoming requests at a time.
Push-based systems are implemented by popular tools such as Logstash, Graphite, Elasticsearch, OpenTSDB, Kibana, Tlegraf, InfluxDB, Chronograph, Kapacitor, etc.
Pull Based Model
In this model, the Centralized server(Prometheus) pulls the metrics from its targets. Here, the Centralized server must know about its targets, that's why they contain the list of all targets from which it has to pull metrics.
Pull-based systems are implemented by popular tools such as Prometheus, Zabbix, Nagios, etc.
Pull Vs Push Model
In a pull-based model, it is easier to know if any of its targets are down. Whereas in the push-based model, the centralized server has no idea whether the system is down or has been decommissioned.
Push-based systems could potentially overload Centralized server collecting metrics if too many incoming connections get flooded at the same time. Such a situation is known as a "thundering herd" which means overloaded due to heavy traffic.
Whereas, pull-based systems have a definite list of targets to monitor, creating a central source of truth. But what if new targets come, then in that case we need to manually add those targets to the target list. Whereas in a push-based system, no need to remember any of its targets. But this problem in a pull-based system can be solved via Service Discovery.
Do You Know ??
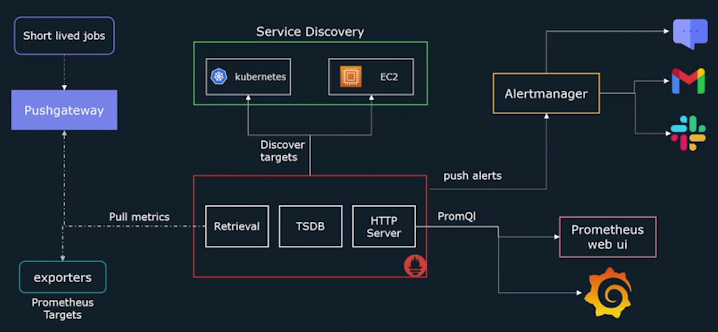
Although Prometheus is implemented on a pull-based model. But it also supports a push-based model via a push gateway. We will learn about it later.
So far we learned about the Whitebox monitoring systems, data to be exposed via the "/metrics" endpoint, and these metrics to be pulled or scraped from the target machine by a centralized server called Prometheus.
Now we will learn what kind of metrics to expose or observe??
There are 3 models suggested for that:
Google's four golden rule:
- It states, pretty straightforward that the four most important metrics to keep track of are the following:
- Latency: The time required to serve a request.
- Traffic: The number of requests being made.
- Errors: The rate of failing requests.
- Saturation: The amount of work not being processed, which is usually queued.
Brendan Gregg USE method:
- Brendan’s method is more machine-focussed and it states that for each resource like CPU, Disk, Network Interface, and so on, the following metrics should be monitored:
- Utilization: To measure the % of the resources that were busy.
- Saturation: The amount of work the resource was not able to process, which is usually queued.
- Errors: Amount of errors that occurred.
Tom Wilkie's RED method:
- The RED method is more focused on the service-level approach and not so much on the underlying system itself.
- Rate: Translated as requests per second.
- Errors: The amount of failing requests per second.
- Duration: The time taken by those clients.
That's all about monitoring. Next, we will learn about Metrics in Prometheus.


Comments
Post a Comment